

The US Treasury yield curve today is not inverted, and short-term yields remain clustered just below 3.6%.
The U.S. Treasury yield curve today is drawing close attention from investors, economists, and policymakers as it continues to reflect the evolving balance between inflation expectations, economic growth prospects, and interest rate policy.
As of December 29, 2025, the yield curve presents a mixed but telling picture of market sentiment across short-, medium-, and long-term maturities.
With short-term yields remaining elevated and long-term yields significantly higher, the curve offers insight into how markets are pricing future economic conditions and monetary policy decisions.
Understanding the Treasury Yield Curve
The Treasury yield curve plots interest rates on U.S. government debt across different maturities, ranging from very short-term instruments like one-month bills to long-term bonds such as 30-year Treasuries.
Under normal economic conditions, longer maturities typically carry higher yields to compensate investors for inflation risk and uncertainty over time.
When short-term yields approach or exceed long-term yields, it can signal expectations of slower growth or potential recessionary pressure.
Conversely, a steep curve often reflects optimism about economic expansion and future inflation.
The current curve sits somewhere between these traditional signals, suggesting markets remain cautious but not decisively pessimistic.
US Treasury Yield Curve Snapshot Today
The latest Treasury yield data highlights how yields are distributed across the curve:
- 1-month yield: 3.602%
- 1-year yield: 3.481%
- 2-year yield: 3.459%
- 10-year yield: 4.112%
- 30-year yield: 4.803%
Short-term yields remain clustered just below 3.6%, reflecting expectations that the Federal Reserve will keep policy rates relatively firm in the near term.
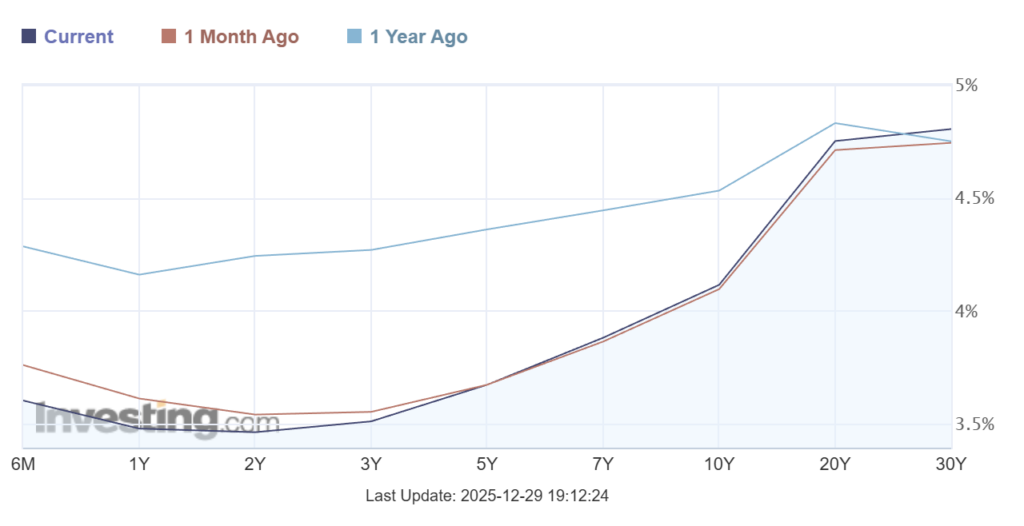
Meanwhile, longer-dated yields move sharply higher, particularly at the 30-year level, which sits well above 4.8%.
This spread indicates that investors continue to demand higher compensation for holding long-term government debt.
What the Shape of the Curve Signals
The current yield curve is no longer deeply inverted, but it is not fully normalized either.
Yields on one-year and two-year Treasuries remain below the one-month yield, showing that near-term policy expectations remain restrictive.
At the same time, the jump from the two-year yield to the 10-year yield suggests longer-term economic uncertainty and persistent inflation risk.
This configuration implies markets believe short-term rates may eventually ease, but not rapidly.
Long-term yields staying elevated indicate concerns about fiscal deficits, debt issuance, and the long-run cost of capital.
Key signals from today’s curve include:
- Continued caution about near-term economic momentum.
- Expectations of higher borrowing costs over the long run.
- Reduced likelihood of aggressive rate cuts in the immediate future.
Short-Term Yields and Federal Reserve Policy
Short-dated Treasury yields are heavily influenced by Federal Reserve policy expectations.
The one-month yield at 3.602% reflects confidence that policy rates will remain restrictive in the immediate future.
The slight decline moving out to the one-year and two-year maturities suggests markets anticipate some moderation in policy over time.
However, the modest slope between these maturities indicates that investors are not pricing in a sharp pivot toward lower rates.
This aligns with a broader view that inflation pressures, while easing, remain a factor that prevents rapid policy easing.
Long-Term Yields and Economic Outlook
The rise in yields at the long end of the curve is one of the most notable features today.
The 10-year yield above 4.1% reflects uncertainty about long-term inflation trends and the durability of economic growth.
The 30-year yield nearing 4.8% signals heightened concern over structural factors such as government borrowing needs and long-run fiscal sustainability.
Investors holding long-dated Treasuries face greater exposure to inflation risk and interest rate volatility, which helps explain the higher yields demanded.
These elevated long-term rates also influence mortgage rates, corporate borrowing costs, and equity valuations.
Implications for Markets and the Economy
The shape of the Treasury yield curve continues to influence financial decision-making across asset classes.
For bond investors, the curve offers opportunities to lock in higher yields at longer maturities, albeit with greater duration risk.
For equity markets, higher long-term yields can pressure valuations, particularly in growth-oriented sectors sensitive to discount rates.
For consumers and businesses, elevated long-term yields translate into higher costs for mortgages, auto loans, and capital investment.
At the same time, the absence of a sharp inversion suggests that markets are not signaling an imminent recession.
Instead, the curve points toward a slower, more measured economic environment.
Market implications to watch include:
- Borrowing costs remaining elevated for households and companies.
- Increased focus on duration risk in bond portfolios.
- Greater sensitivity of markets to inflation and fiscal developments.
Why the Yield Curve Still Matters
The Treasury yield curve remains one of the most closely watched indicators in financial markets.
While it is not a perfect predictor, its movements provide valuable insight into collective expectations about growth, inflation, and monetary policy.
Today’s curve reflects a market that is neither complacent nor alarmist.
Instead, it suggests a period of adjustment, where interest rates may stay higher for longer, and economic momentum remains steady but cautious.
As investors monitor upcoming economic data and policy signals, changes in the yield curve will continue to shape expectations well into the coming year.