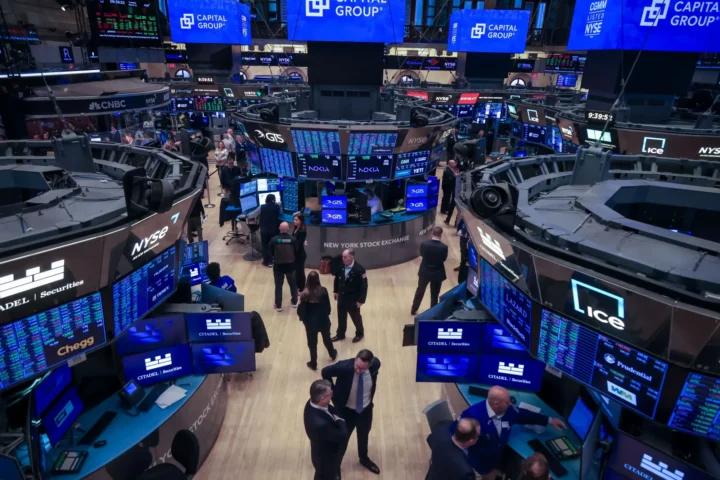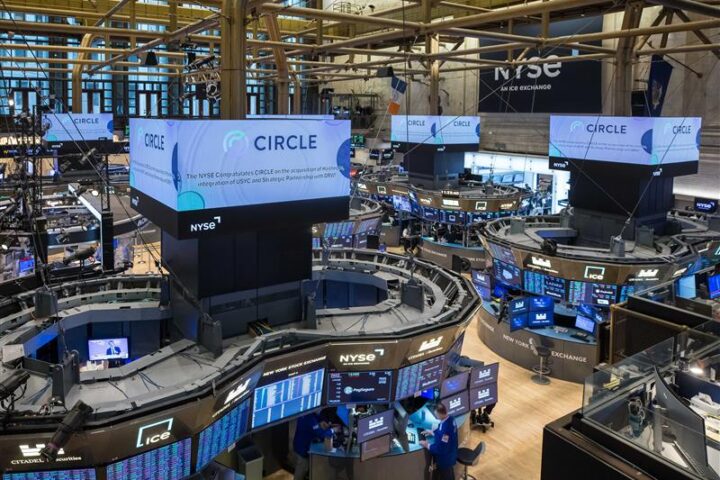
The stock market’s best quarter in years ended in late June, but conditions have shifted considerably since then.
The S&P 500 (SNPINDEX: ^GSPC) has fallen nearly 1% so far this month, while the Nasdaq Composite (NASDAQINDEX: ^IXIC) has dropped close to 3.5% over three consecutive weeks of declines.
Surging oil prices threaten to reignite inflation, and tech companies face mounting scrutiny over their aggressive artificial intelligence spending commitments.
Against this backdrop, a key market valuation metric closely associated with Warren Buffett is now flashing its most alarming reading in history.
The metric in question measures the ratio of total U.S. stock market value to gross domestic product, widely known as the Buffett indicator, and it currently sits at just over 236%.
That figure is the highest the indicator has ever recorded, surpassing even the frothy levels seen during the late 1990s dot-com boom.
In a 2001 interview with Fortune magazine, Buffett was direct about what elevated readings on this metric mean for investors.
“If the ratio approaches 200% — as it did in 1999 and a part of 2000 — you are playing with fire,” Buffett said in that interview, a threshold the current reading now far exceeds.
Buffett also noted in the same interview that when “the percentage relationship falls to the 70% or 80% area, buying stocks is likely to work very well for you.”
A second major valuation metric is reinforcing the concern, with the S&P 500 Shiller CAPE ratio currently sitting at just over 41, the second highest reading the measure has ever produced.
The Shiller CAPE ratio evaluates the S&P 500 against 10 years of inflation-adjusted earnings, giving a longer-term view of whether the market is stretched relative to underlying corporate performance.
The only time this ratio climbed higher was during the lead-up to the dot-com crash, when it reached an all-time peak of 44 before the bubble burst and markets collapsed.
Earlier historical spikes in the Shiller CAPE ratio also occurred before the Great Depression, when the measure surpassed 30 and preceded years of severe economic damage.
Analysts caution that high valuations alone do not guarantee an imminent crash, since corporate valuations have trended upward over recent decades as business models and profit margins have evolved.
However, the current concentration of market value in technology and AI-related stocks raises the stakes considerably if speculative enthusiasm is outpacing fundamental performance.
The dot-com era offers a sobering historical parallel, as hundreds of internet companies soared in value before collapsing entirely when investor sentiment reversed.
The Nasdaq Composite lost nearly 80% of its value between 2000 and 2002, though fundamentally strong technology companies eventually recovered and pushed the index to new highs in subsequent years.
That historical outcome underscores a consistent lesson from past market cycles: stocks with solid financial foundations tend to weather downturns and reward long-term investors, while richly priced companies built on hype carry the greatest risk of permanent loss when conditions deteriorate.
Investors navigating the current environment are being urged to focus on stock quality over momentum, with the understanding that overvalued companies with weak fundamentals typically suffer the steepest declines when corrections arrive.