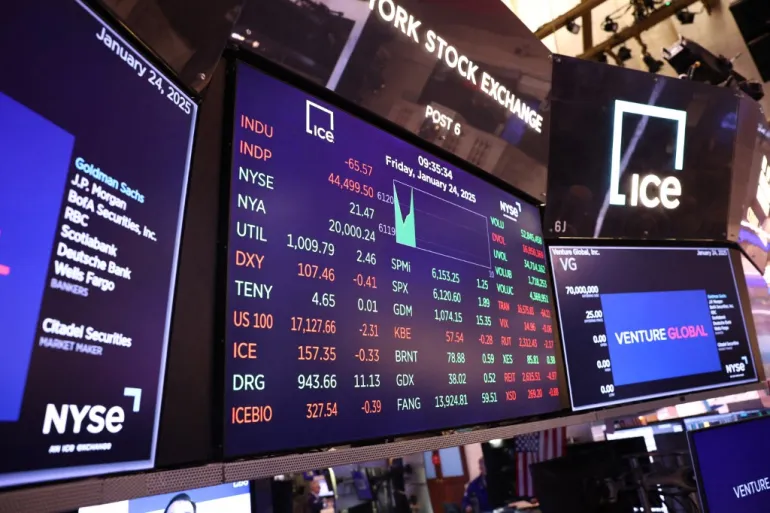
Wall Street has delivered strong gains through mid-September 2026, with the Dow Jones Industrial Average (^DJI), S&P 500 (^GSPC), and Nasdaq Composite (^IXIC) up 8.4%, 10.8%, and 11.8% respectively.
The ongoing bull market, now approaching its fourth full year, has been powered by artificial intelligence expansion, better-than-expected corporate earnings, and favorable tax policy driving record S&P 500 share buybacks.
Despite the impressive performance, history offers a sobering warning that no bull market lasts forever, and several indicators suggest this one may be running out of time.
Among the most pressing concerns are near-record-high outstanding margin debt, persistently elevated inflation, and rapidly rising U.S. debt levels that together form a significant headwind for equities.
One valuation tool in particular has a flawless historical track record of foreshadowing major market downturns, and right now it is flashing a serious warning signal.
The S&P 500’s Shiller Price-to-Earnings Ratio, also known as the Cyclically Adjusted P/E Ratio or CAPE Ratio, back-tested to January 1871, has consistently preceded significant market disasters when elevated.
Unlike the traditional P/E ratio, the Shiller P/E is based on average inflation-adjusted earnings over the prior 10 years, making it reliable across economic cycles, including recessions.
Since 1871, the S&P 500’s Shiller P/E Ratio has averaged 17.42, but as of the closing bell on September 15, it stood at nearly 41, far above its long-run norm.
Over nearly 156 years of data, the CAPE Ratio has exceeded 30 on only six occasions, including the present, and each of the previous five occurrences ended in substantial losses for investors.
The first instance ran from August to September 1929, when the Shiller P/E peaked around 33, preceding the Great Depression and an 89% collapse in the Dow Jones Industrial Average.
From June 1997 to August 2001, the CAPE Ratio reached its all-time record high of 44.19 in December 1999, just before the dot-com bubble burst and the S&P 500 and Nasdaq fell 49% and 78% respectively.
The third occurrence, from September 2017 to November 2018, saw the Shiller P/E peak near 33 before a fourth-quarter sell-off erased roughly 20% of the S&P 500’s value.
From December 2019 to February 2020, the CAPE Ratio topped out around 31, setting the stage for the COVID-19 crash that sliced 34% from the S&P 500 in just 33 calendar days.
The fifth instance, spanning August 2020 to May 2022, saw the Shiller P/E briefly jump above 40 for only the second time ever, followed by a bear market with peak-to-trough declines of approximately 20%, 25%, and 33% for the Dow, S&P 500, and Nasdaq respectively.
The current sixth instance began in November 2023 and has thus far seen the CAPE Ratio peak at 42.84 on June 1, leaving markets in historically dangerous valuation territory.
While the metric cannot pinpoint when a downturn will begin or what catalyst will trigger it, its track record of predicting declines of 20% or greater when valuations become overextended is unblemished.
However, history is not only a bearer of bad news for investors willing to take a longer-term view of market cycles and their aftermath.
Analysts at Bespoke Investment Group published data in late May examining S&P 500 bull and bear markets dating back to September 1929, revealing a striking imbalance between the two cycles.
The average S&P 500 bear market lasted just 286 calendar days, roughly 9.5 months, and no bear market in the data set persisted beyond 630 calendar days.
By contrast, the typical S&P 500 bull market has lasted 1,023 calendar days over the past 97 years, approximately 3.6 times the length of the average bear market.
For patient investors, any coming downturn may ultimately represent a prime opportunity to acquire shares in quality businesses at significantly more attractive valuations.