Wall Street is flashing a warning signal so rare it has only appeared six times since January 1871, raising serious concerns for investors.
The S&P 500 (SNPINDEX: ^GSPC) Shiller P/E Ratio, also known as the Cyclically Adjusted P/E Ratio or CAPE Ratio, closed at nearly 40.5 as of July 27, far above its long-run average of 17.4.
The CAPE Ratio is widely considered one of the most reliable valuation tools available, using trailing 10-year earnings per share to smooth out distortions caused by recessions.
Since January 1871, there have now been six instances where the CAPE Ratio exceeded 30 during a continuous bull market lasting at least two months, and the current period is the sixth such occurrence.
The current bull market peaked at a Shiller P/E of 42.84 in early June, marking the second-highest multiple recorded across the entire 155-year history of the data set.
Every one of the previous five occurrences ended badly, including the 89% collapse in the Dow Jones Industrial Average (DJINDICES: ^DJI) following the August to September 1929 readings that preceded the Great Depression.
The dot-com bubble, which peaked with a record CAPE Ratio of 44.19 in December 1999, resulted in the S&P 500 losing 49% of its value and the Nasdaq Composite (NASDAQINDEX: ^IXIC) plunging 78%.
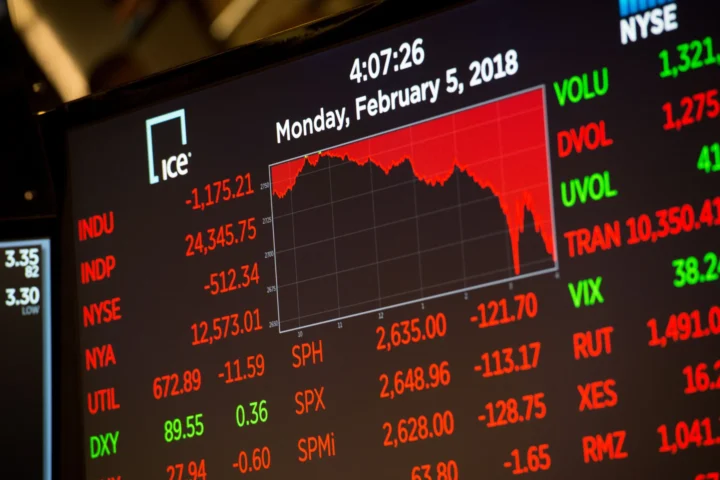
More recent episodes are equally sobering, including a 20% drop in the S&P 500 during the fourth quarter of 2018 and a 34% plunge in just 33 calendar days during the COVID-19 crash of 2020.
The fifth prior occurrence ran from August 2020 to May 2022, during which the CAPE Ratio briefly crossed 40, signaling the start of a bear market that slashed the Nasdaq Composite by one-third.
Despite the historical warnings, analysts at Bespoke Investment Group published data showing that the average S&P 500 bull market has lasted 1,023 calendar days since the Great Depression, roughly 3.6 times the average bear market length of 286 calendar days.
Of the 27 bull markets tracked since September 1929, just over half, specifically 14, have lasted longer than the longest bear market on record, reinforcing the statistical case for long-term optimism.
The Shiller P/E Ratio cannot pinpoint when a downturn will begin or identify which catalyst will trigger it, but its track record of foreshadowing eventual declines remains unblemished across all five prior instances.
Margin debt has risen parabolically in recent months, and concerns about higher interest rates slowing artificial intelligence data center investment are also adding pressure to an already stretched market environment.
For investors with a long-term horizon, history consistently shows that wagering on the eventual recovery and continued growth of the U.S. stock market has been a winning strategy across nearly a century of data.