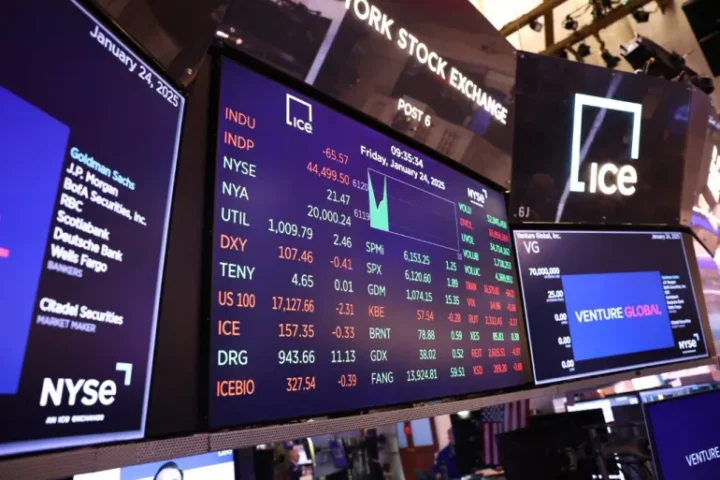
The S&P 500 is now trading at valuations not seen since the height of the dot-com bubble, raising fresh questions about what comes next for investors.
The Shiller price-to-earnings ratio, also known as the CAPE ratio, has climbed to 42.2, its highest reading since the dot-com bubble peak when it hit 44.2 in November 1999.
The CAPE ratio measures how expensive the S&P 500 is by examining company earnings over the past 10 years and adjusting them for inflation to remove distortions from one-off events.
With the average CAPE ratio since 1990 sitting at just over 27, the current reading of 42.2 illustrates just how stretched market valuations have become by historical standards.
The dot-com bubble remains one of the most speculative periods in stock market history, driven largely by investors pouring money into unproven internet businesses with little or no revenue.
At the peak of that bubble in March 2000, the S&P 500 reached 1,527 points before losing approximately 50% of its value over the following two and a half years.
However, drawing a direct comparison between today’s market and the dot-com era is not entirely straightforward, as the dynamics driving current valuations are meaningfully different.
Much of today’s market expensiveness is driven by the artificial intelligence boom and the surging valuations of major technology companies, many of which are highly profitable and generating significant revenue.
The S&P 500 is currently heavily concentrated in the so-called Magnificent Seven stocks, which investors are willing to pay a premium for given their dominant market positions and earnings power.
Experts caution that past results do not guarantee future performance, and assuming a repeat of the dot-com crash could lead investors to make costly timing mistakes.
As the old saying goes, “Time in the market beats timing the market,” and staying invested through volatility has historically rewarded patient, long-term investors.
One practical strategy gaining renewed attention is dollar-cost averaging, where investors commit to a fixed investment amount on a set schedule regardless of market conditions.
Whether an investor chooses to invest weekly, biweekly, or monthly, the discipline of dollar-cost averaging helps remove the temptation to try predicting short-term market movements.
Investors who remain consistently invested over the long haul typically outperform those who attempt to time market peaks and troughs, a pattern borne out repeatedly across market cycles.
While elevated CAPE ratios can signal potential future underperformance, they are not precise timing tools and should be viewed primarily as a source of historical context rather than a sell signal.